Intro
Free solar panel angle and energy calculations
Your idea for installing a solar panel is great and you do at least two good things by doing so:
- Prevent global warming and pollution
- Improve your household budget by investing in clean energy
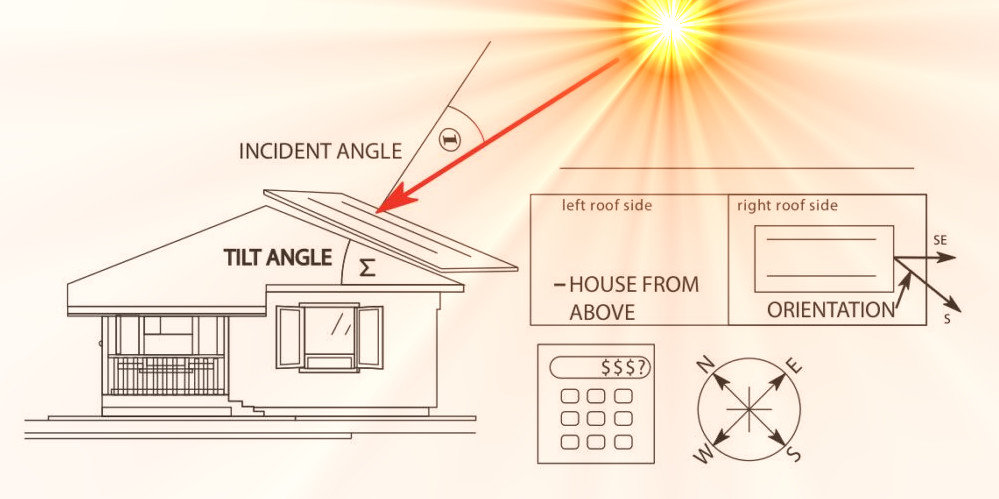
Solar equipment vendors advise a south-facing roof pitch of 30 degrees. Is that right? What do we own? Let’s see what we can actually get!

calculator
Solar Panel Angle Calculator (SPAC)
If you have decided to invest in solar panels and do not know where to start, then you are in the right place: The Solar Panel Angle Calculator (SPAC) calculates: the setting angle for fixed and tilting panels, obstacles (shadows from neighboring objects such as trees, houses, etc.) and the energy you can get. That doesn’t mean you won’t need advice or a project from solar installers, but you’ll have a pretty good starting point that no one will be able to scam you in the worst case scenario. You will also know (based on your roof orientation where you are placing the solar panel) what you can expect in terms of how much electricity you will get and thus the economic return. All you have to do is to enter a few data about the object on which you are installing solar panels, namely: the latitude of the place where your object is located (or choose from the list of cities) you are planning, the orientation and the slope of the roof. For now, SPAC only considers the Northern Hemisphere: USA, Mexico, Canada, Europe and Asia. The potential of these locations is good due to their generally good sunny conditions, especially in the central US and southern Europe. Asia has great potential, especially for Arab, Middle Eastern countries, India, Indochina. It is very important that at least one part of the roof is facing south. If your roof facing completely to the west or completely to the east, then the calculations of this application are not valid.
Roof faced on the north is out of question.
Solar panel on roof house
solar panels on a roof that is at least partially facing south (south south-east or south-west)
Mini solar power plant
Small solar power plant located on the backyard or any unused land.
two basic typesin solar investments
Roof or back yard
Solar panel on the roof top
The ideal angle of a fixed panel on the roof or on ground - depending on the geographical location of your property. As noted, this angle is usually recommended at 30 degrees for continental climates. SPAC calculate with a stochastic formula that also takes into account the number of sunny days. If the roof has its own slope, then the setting angle is dictated by that parameter and the ideal angle is not taken into account. SPAC presents you the angles based on which we calculate the harmful the influence of the shadow of the surrounding objects and the energy we can expect. In the case of a flat roof, we can use the ideal angle and install fixed panels or use the calculation for floating panels, depending on what you choose.
Mini solar power plant
There are several variants in case you decide on a small solar power plant on ground.
1- Fixed solar panels facing south
2- Solar panels facing south with the possibility of angle adjustment along one axis
3- Sun follow solar panels with the possibility of tilting along two axes SPAC calculates all relevant adjustment angles for all three cases. In the case of movement along one axis, the adjustment angle depends on the geographical position and the day of the year. In the case of the sun follow system, an additional parameter is included: the hour angle.
maximum efficiency
Following the sun
The solar panel does not have to be fixed, as I mentioned earlier. It is possible to adjust the panel so that the sun’s rays fall at an angle of approximately or exactly 90 degrees - to increase efficiency.
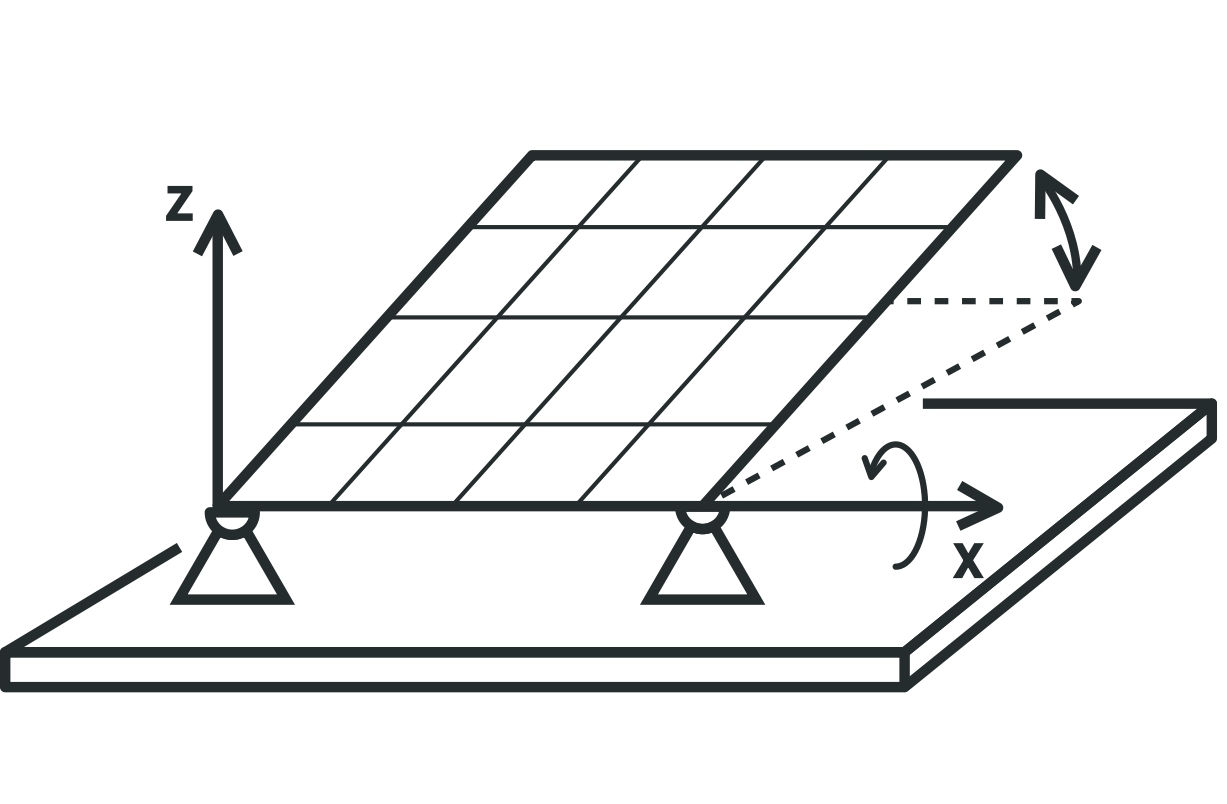
One axis tracker
Adjusting the panel by rotating around one axis is done depending on the day of the month or the month of the year. For this purpose, we need the altitude angle data that SPAC calculate by on the latitude of your installation location. This panel can stand completely horizontally in the case of cloudy weather when only the diffuse radiation component is used. Settings can be done manually or automatically.
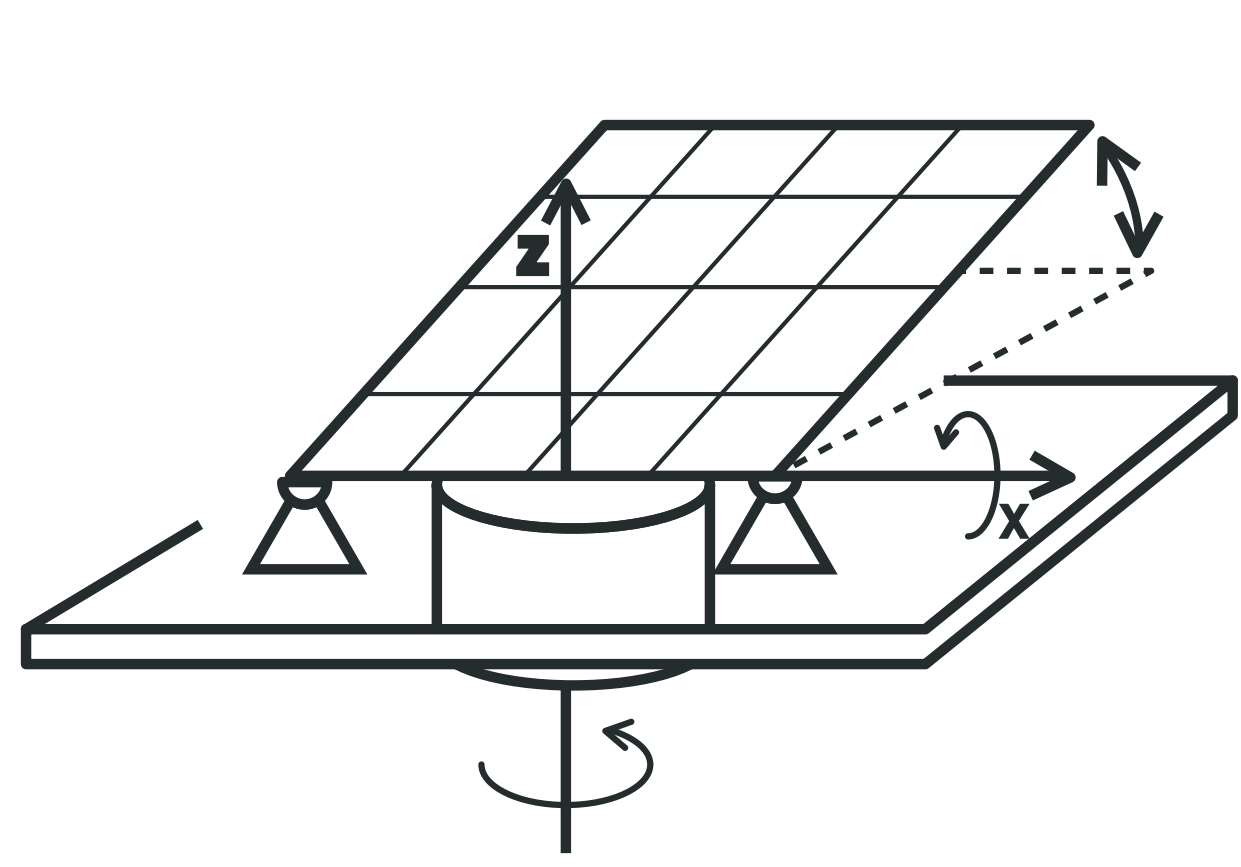
Sun follow panel, two axis tracking
The sun follow panel has a much higher efficiency, but also a more complicated tracking system which requires rotation around the vertical axis depending on the time - the hour angle. The rest is similar as one axis adjustment system. So its adjusments depends from date and time and couldnt be done manualy.
obstacles
Shadows
The altitude angle is greater in summer than in winter, which means that the shadow is smaller. So we can say the sun is lower in winter than in summer. The shadow of surrounding objects is longer in winter than in summer. SPAC calculates the altitude and azimuth angles for each solar hour, so that we can calculate the length and position of the shadow of surrounding objects and possibly conclude whether and how much shadow will partially obscure the solar panel.
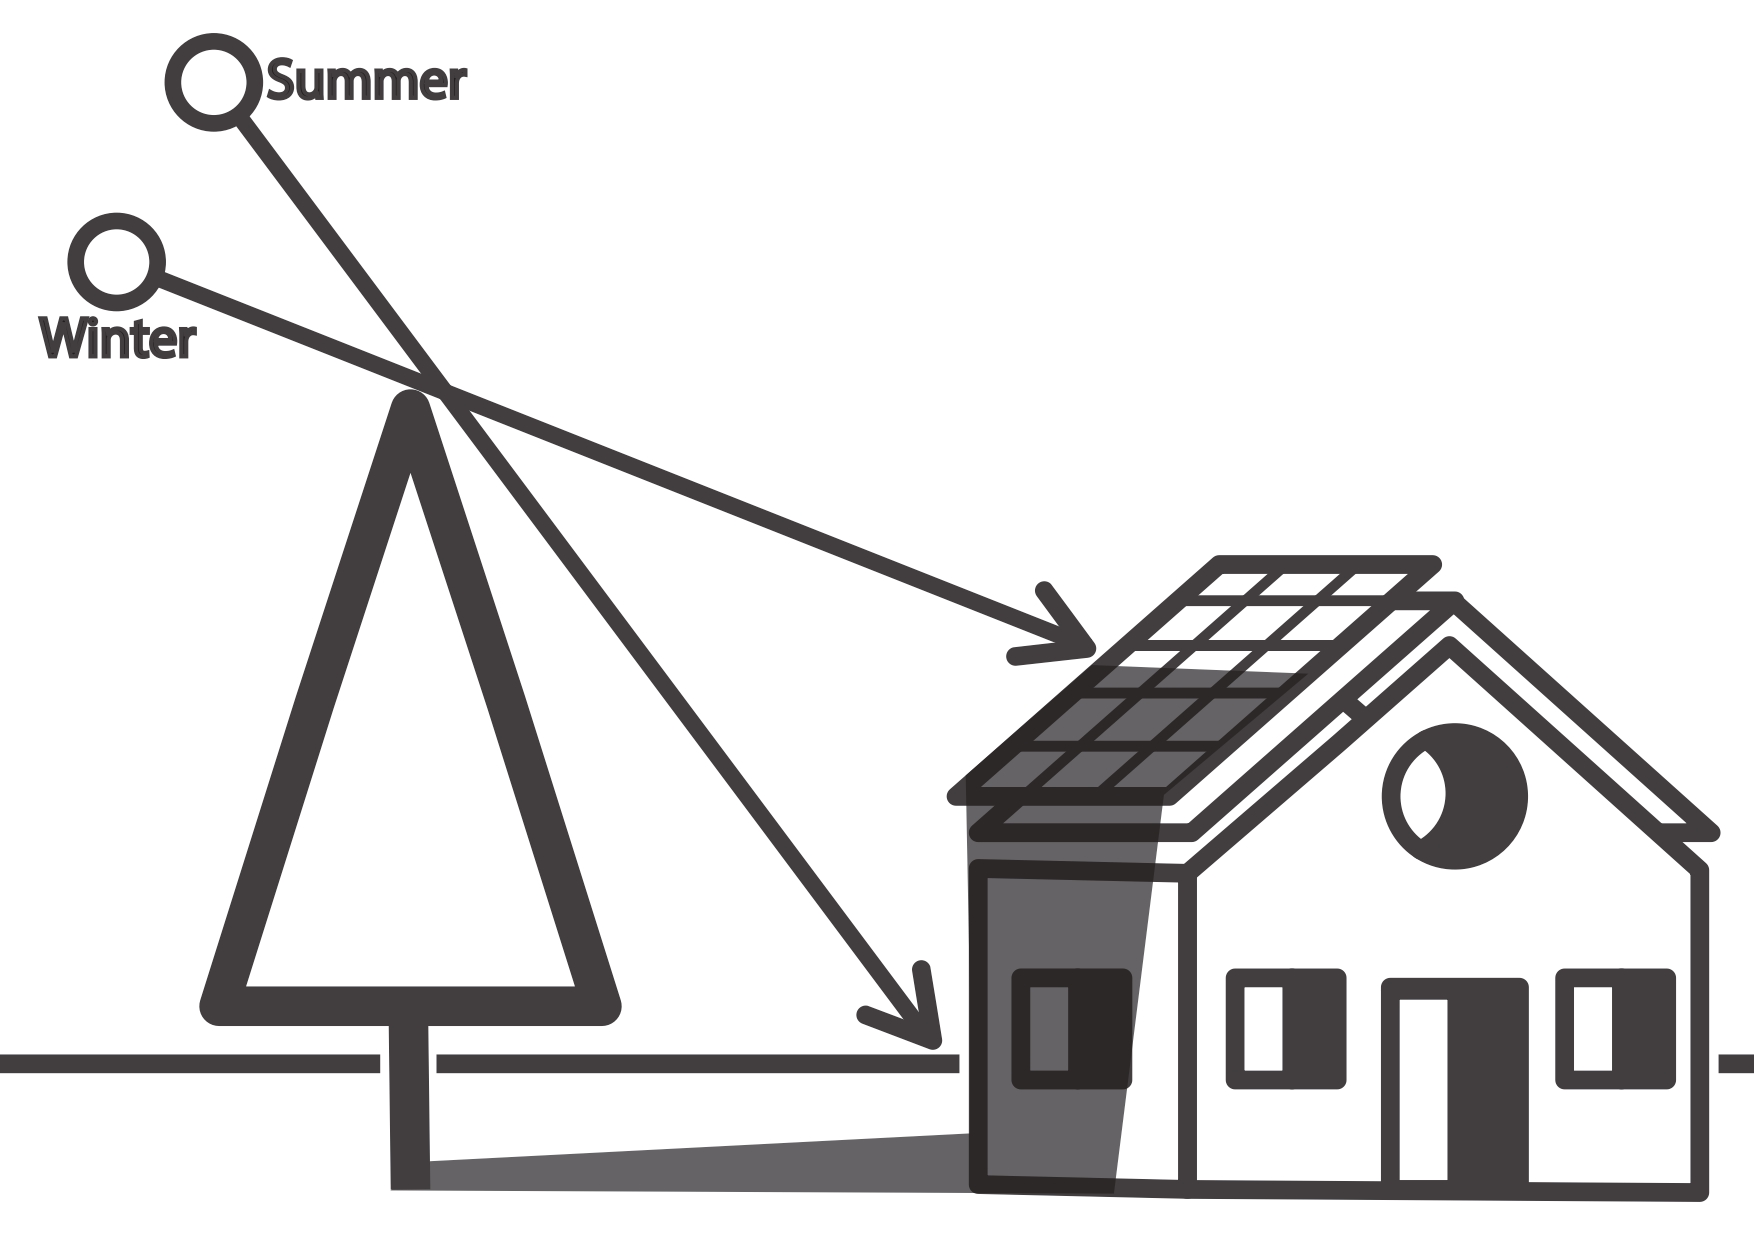
The harmful influence of surrounding objects
Trees, surrounding houses, or any nearby objects that exceed the level of the solar panel can have a harmful effect by casting a shadow, especially in winter.
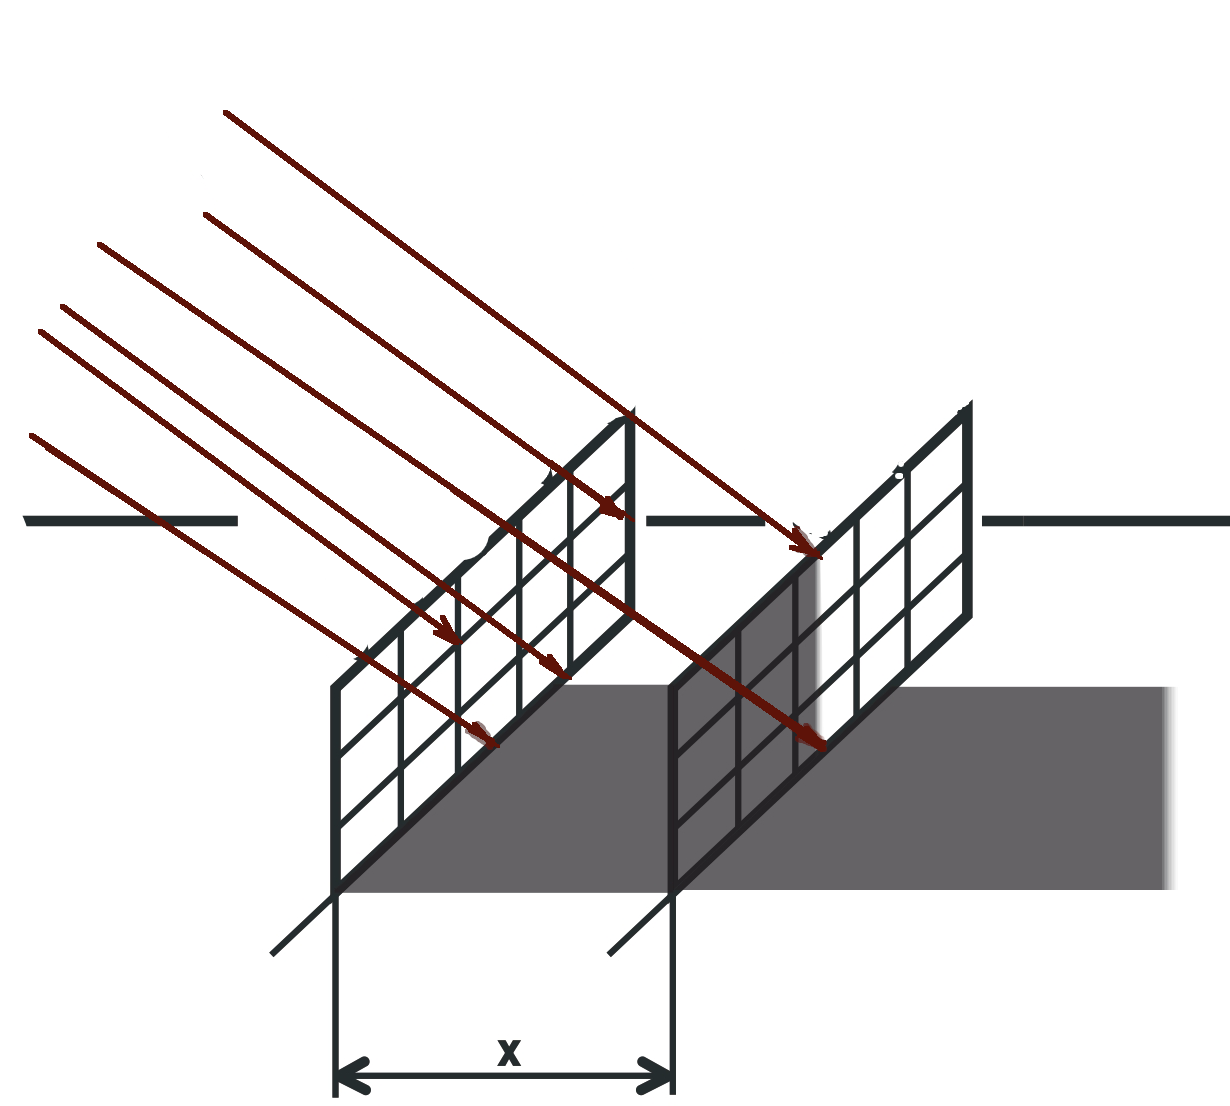
Improper solar panels distance
If solar panels are placed too close to solar power plants, a shadow effect may occur, where one panel partially obscures the other
Interests
- Mechanikal calculations
- Programing
- Mini solar plants
