It s a time to analyses results from obtained data form index file. The
results are divided into two main sections, depending on which data
we entered on index page:
- theoretically
- real-data estimation
Theoretical data : Angles
First of all, it should be noted that three
main parameters must be selected in the main form of the program.
- Select a nearby city or manually enter latitude
- The angle of the roof
- Orientation to the south.
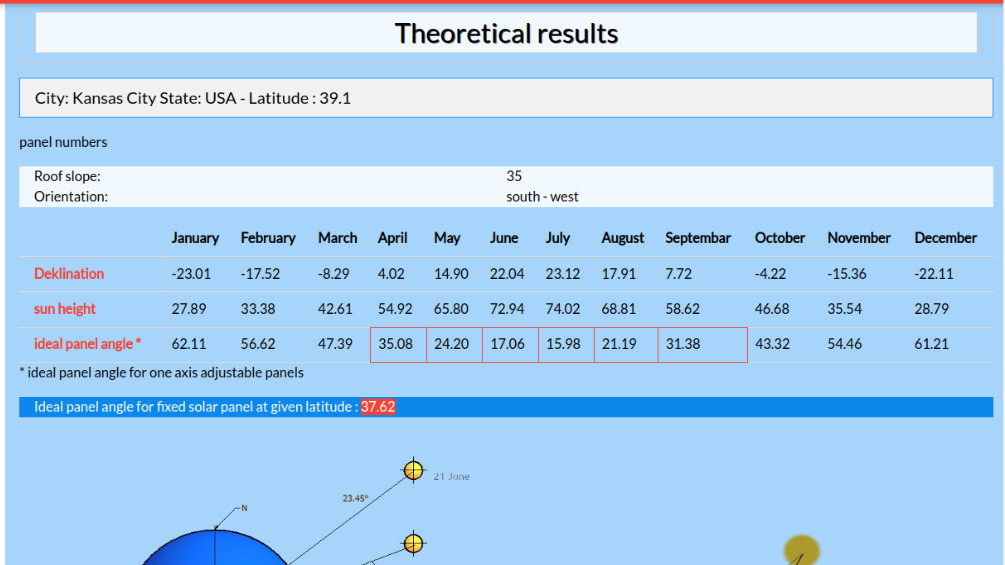
If at least one of these required parameters is not entered, we will not get the results needed for the analysis. TIP see how to measure . By entering these three parameters, conditions were created for the display of theoretical results. The first table in the theoretical presentation of the results gives the following data:
Declination, Sun Height, and Ideal Panel Angle for an Insignificant Day in Every Month.
Declination is not such an important parameter for anything else except further calculations.
The azimuth angle at solar noon for the characteristic date is actually the height of the sun. Characteristic date is every first day in month. For a single setup PV module angle
at a single axis tracking system, the ideal panel angle could be used. And finally, in a special blue bar, the ideal panel angle for a fixed panel at a given latitude is displayed. It is calculated depending on the latitude, this is classic system used by sellers and
installers of solar panels. However, if a specific city is selected (instead of manually entering the latitude), we will get a much more precise angle that also takes into account the statistical weather
component implemented by the site author. The following table presents the azimuth and altitude angles for every month at every
hour in the range from 7 to 17 hours. These data are used for further
calculation and can be used to calculate the harmful effect of the shadows of surrounding objects.

Theoretical data: Energy
Table 3 contains the extraterrestrial radiation Io and the flux of solar radiation Ib, both in [W/m2]. These quantities are also used for further calculations. Table 4 is the most important from the point of view of my system of calculating the real values of the obtained energy – the incident
angles for fixed panels. It is desirable that the incident angle of sunlight and normal solar panel vector have been as close as possible to 0, i.e., that the sunlight falls at a right angle on the panel
surface, in order to make maximum use of the kinetic energy of the photons, E = mc2* cosθ. I use these angles for furthered calculation of the real-day
electricity estimation. Table 5 contains the components of irradiation falling on the solar panel, which are:
- Direct falls directly on the solar panel
- Diffuse: light that scatters from the clouds
- Reflected: Light reflected from the environment
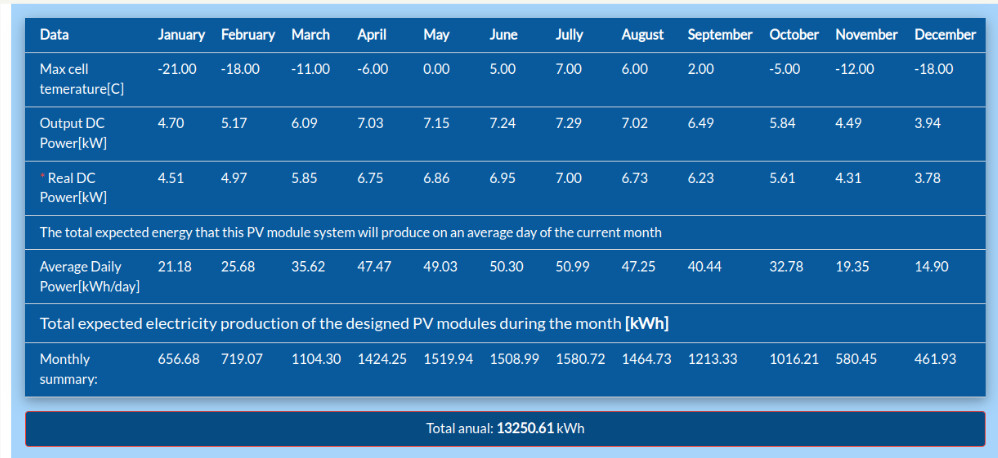
All these components are added up and directly affect the further calculation of real electric energy to obtain an estimation.
The second part is calculations is…

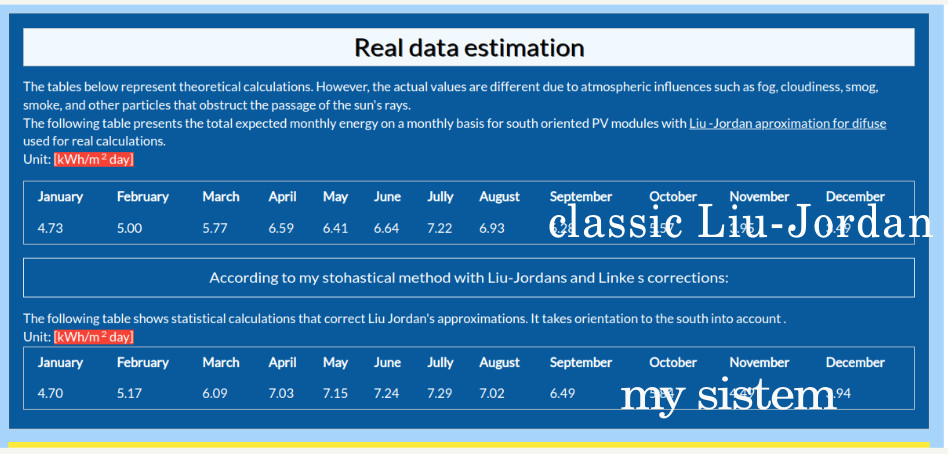
The real estimated energy gain - what does we got
The most exciting part of the calculation is
the real data on how much electricity and energy we can count on in
the event that we choose that option by checking the roof and
entering the same dimensions or choosing the desired network of solar
panels.
Important note: Real estimation will not work if you do not select a
specific city in the offer but enter the latitude, because the given
list of cities has statistically processed data that the program
uses. In order to obtain this data, it is necessary to select the
desired solar panel in the main part of the program in the Panel grid
or roof dimension section. The offer in the drop-down list includes
some solar panels of leading manufacturers. In addition to the
panel type and model, the display also includes its power and
dimensions. After choosing a particular solar panel, it is necessary
to choose one of two options:
The roof dimensions: an example
| Monthly | 559 | 555 | 723 | 807 | 847 | 830 | 864 | 832 | 745 | 694 | 516 | 469 |
The grid panel : an example
| Month | Jan | Feb | Mar | Apr | May | Jun | July | Avg | Sep | Oct | Nov | Dec |
| Monthly | 1118 | 1111 | 1447 | 1615 | 1659 | 1660 | 1728 | 1664 | 1491 | 1388 | 1033 | 938 |
Inverrter selection and profit calculation
- Inverter in accordance with the selected PV modules
- The total annual profit according to electric power production.
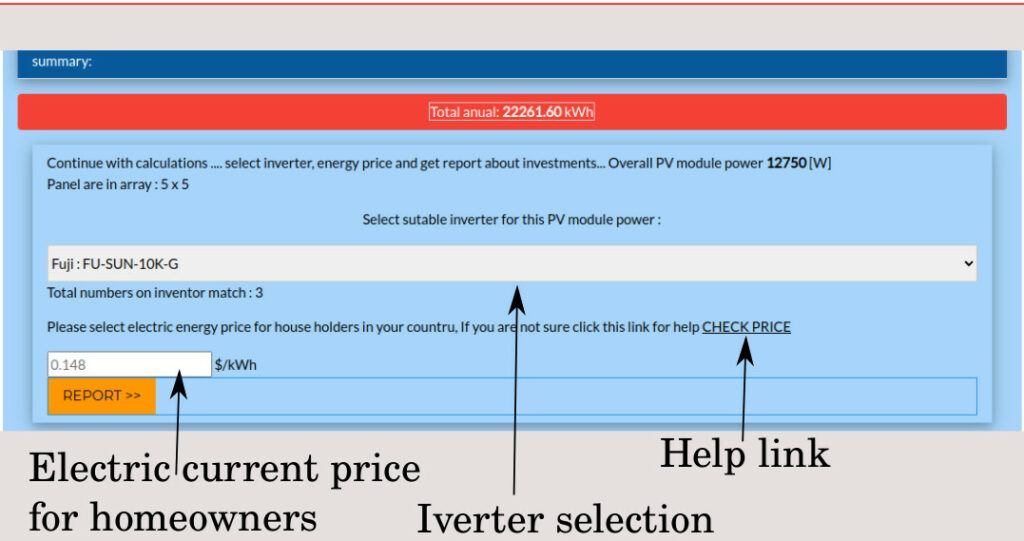
All you have to do is fill text box with electric price for home owners. But since the vast majority of us do not know what the current price of electricity is, you can find that information by clicking on the link. Next step is click on REPORT button and we will get Final report
The Final Report
Well, that’s it. We have an example somewhere in the Middle East where we invested in 25 Axilitec PV modules with 365 kW power and a Fronius Symo 5.0 inverter. Panels are facing south at a fixed angle of 20 degrees. We can expect an annual profit of about 2198 USD.
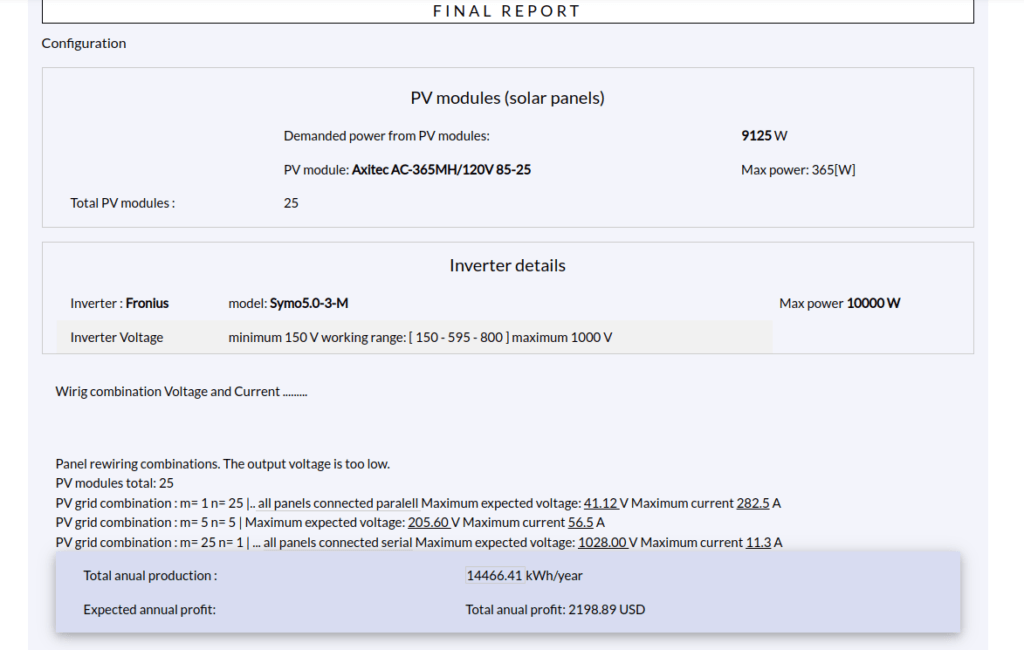
Final Report version 1.27
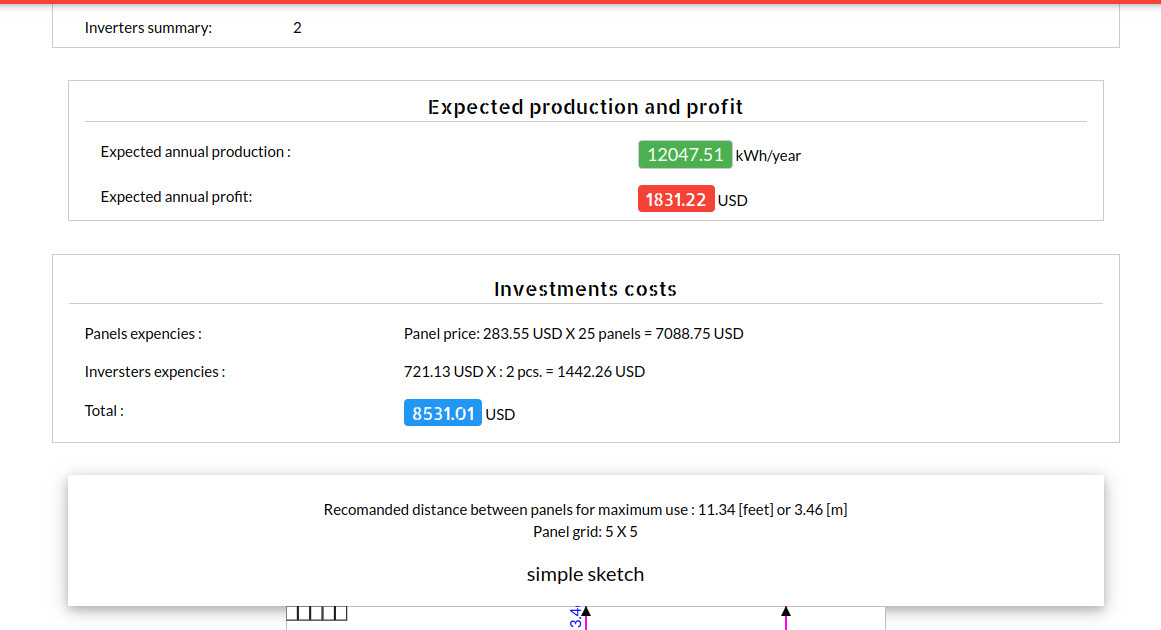
Version 1.27 offers some improvements and some simplicities. The wiring is removed, and instead the user gets basic information: inverter and panel costs and expected annual profit
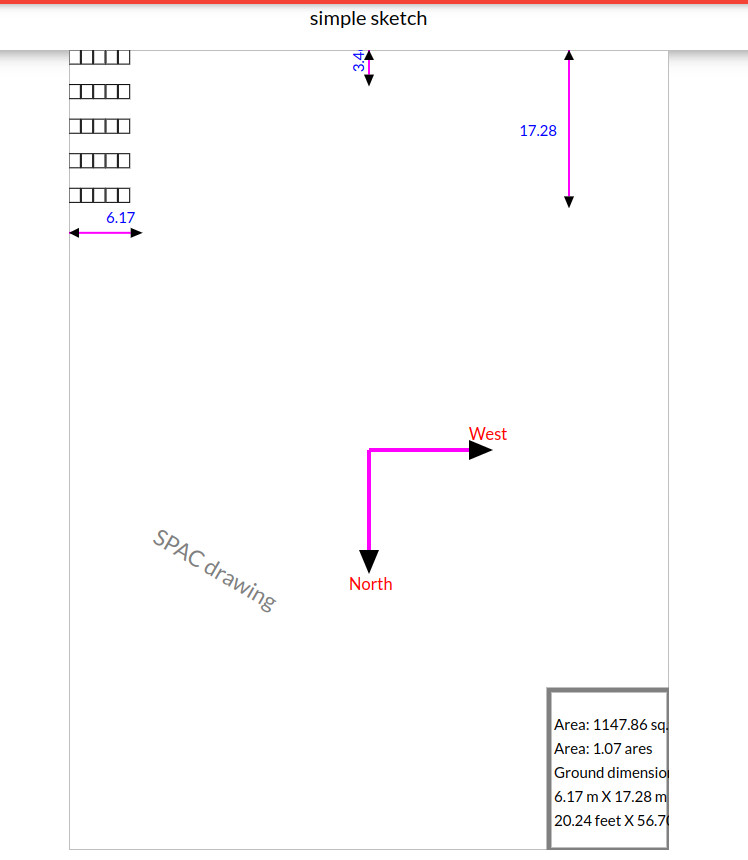
The second example is near New York City. We are interested in how much space we need for a small power plant in an array of 5×5 PV modules. Parameters are P.V. modules, type JA JAM54S30 (400W), and inverter(s) Growatt 400 TL3-XH. Of course, we are also interested in energy production and investments.
Conclusion
For all these calculations, you do not need to enter how many electrical devices you have in the house or plan investments and the like. It is enough to look at your monthly bills, and you will see what you can expect from your roof or yard, which you would turn into a free source of electricity for yourself.

